4. Test Results
Test results for sludge concentration and water quality are as below.
![]()
4.1.Sluge Concentration
It was expected that the sludge concentration in the testing tanks would be reduced by the biological treatment. The sludge concentration in the No.1 water tank [100% of bottom sediments,] however, was maintained in a stabilized state as shown on Table 4.1,whereas in the No.2 water tank [67% of bottom sediments plus 33% of activated sludge] the sludge concentration was largely reduced as shown on Table4.2.
|
Days |
Unit |
Staring |
_ |
30days |
_ |
75days |
_ |
|
MLSS |
mg/l |
75,000 |
100% |
56,100 |
74.8% |
73,800 |
97.3% |
|
VSS |
mg/l |
14,900 |
100% |
18,900 |
126.8% |
14,800 |
99.3% |
|
SS-VSS |
mg/l |
60,000 |
100% |
37,200 |
61.8% |
59,000 |
98.1% |
Table 4.1 Changes of sludge concentration in No1 water tank
[sediments 100%]
|
Days |
Unit |
Staring |
_ |
30days |
Item |
75days |
Item |
|
MLSS |
mg/l |
54,800 |
100% |
36,400 |
66.4% |
22,200 |
40.5% |
|
VSS |
mg/l |
12,400 |
100% |
14,600 |
111.7% |
5,850 |
47.2% |
|
SS-VSS |
mg/l |
42,400 |
100% |
21,800 |
51.4% |
16,350 |
38.6% |
Table 4.2 Changes of sludge concentration in No.2 water tank
[sediments 67% plus activated sludge 33%]
Fig 4.1 indicates the changes of SS and VSS in No1 and No2 water tanks. and SS in supernatant and treated water in the tanks.
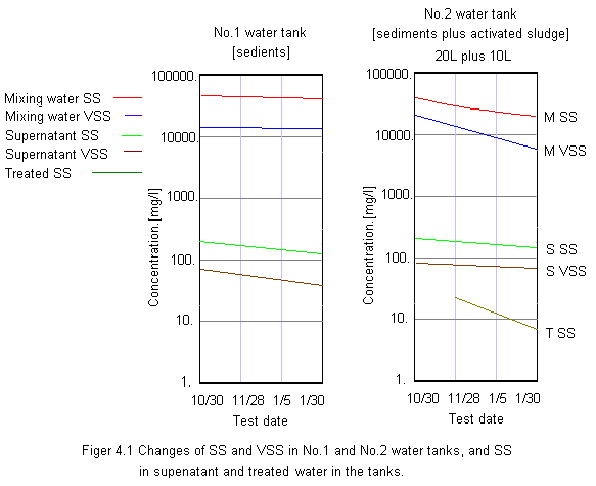
Fig 4.1 Changes of SS and VSS No1 and No2 water tanks, and SS in supernatant and treated water in the tanks. The above figure shows the changes of sludge concentration in the No1 water tank [bottom sediment only] and the No2 water tank[bottom sediment plus activated sludge].The concentration in the No2 water tank was reduced as testing time passed. Thus, the reduction by using the activated sludge was resulted effectively.
_
![]()
4.2. Water Quality Tests
Changes in water quality are shown on table 4.3 and 4.4
|
Test days |
Starting day |
Starting day |
30days |
75days |
100days |
|
Item |
Mixing water |
Supernatant |
Treated water |
Treated water |
Treated water |
|
pH |
8.0 |
5.8 |
6.1 |
6.5 |
6.8 |
|
BOD |
2,200 |
96 |
4.0 |
8 |
1.2 |
|
COD |
5,510 |
91 |
48.9 |
21.8 |
5.2 |
|
NH-N |
66 |
8.4 |
60.4 |
10.8 |
0.2 |
|
NO2-N |
ND |
ND |
0.1 |
2.5 |
ND |
|
NO3-N |
ND |
ND |
0.5 |
22.3 |
0.9 |
|
kJ-N |
222 |
72.5 |
70.6 |
46.7 |
2.1 |
|
T-N |
222 |
72.5 |
70.6 |
71.5 |
3.0 |
|
PO4-P |
4.1 |
0.02 |
0.04 |
0.004 |
0.004 |
|
T-P |
138 |
4.0 |
0.6 |
0.3 |
0.08 |
Table 4.3 Treated water quality in No1 water tank
[Sediment 100%]
|
Test days |
Starting day |
Starting day |
30days |
75days |
100days |
|
Item |
Mixing water |
Supernatant |
Treated water |
Treated water |
Treated water |
|
pH |
7.3 |
6.2 |
5.8 |
5.4 |
6.9 |
|
BOD |
2,100 |
105 |
3.0 |
5 |
1.0 |
|
COD |
5,800 |
130 |
35.5 |
21.6 |
6.2 |
|
NH-N |
15 |
10.1 |
51.6 |
19.2 |
0.3 |
|
NO2-N |
ND |
ND |
0.6 |
0.1 |
ND |
|
NO3-N |
ND |
ND |
0.5 |
41.2 |
1.2 |
|
Kj-N |
250 |
98.2 |
60.4 |
3.2 |
0.7 |
|
T-N |
250 |
98.2 |
61.0 |
46.6 |
1.9 |
|
PO4-P |
6.0 |
0.02 |
0.006 |
0.004 |
0.004 |
|
T-P |
102 |
3.7 |
0.6 |
0.2 |
0.06 |
Table 4.4 Treated water quality in No2 water tank.
[Sediment 67% plus activated sludge]
_
![]()
4.3 Consideration of Sludge Concentration and Water Quality Tests
By these tests, it was found that there were large differences in the changes of sludge concentration between No.1 and No.2 water tanks. And it was proved that the use of the amount of the bottom sediments.
It took 75 days for the tests to get results of the nitrification observed which the activated sludge added to the bottom sediments for acclimation. It also took 100 days for the test to get the expected water quality with performing de-nitrogen treatment by reducing airflow of aeration. According to the activated sludge process, it takes 2 to 3 weeks to reach reaction of nitrification and denitrate by batch type treatment, while it is necessary longer term for the acclimation to treat the bottom sediments by biotechnology .Basically nitrification and de-nitrate reaction can be controlled with a similar process without coagulating treatment. This de-phosphorus would be caused by the reaction of metallic salts contained in the bottom sediments rather than by biological de-phosphorus treatment.
The test results did not show the large difference in the changes of water quality in the No.1 and No.2 water tanks. Effect by the activated sludge used as a seeding sludge is not observed which expected before test. A few days later, rot odor from each testing water tank reduced to remain a slight odor, same as normal activated sludge.
_
![]()
4.4 Changes in Sludge Composition
Changes in the composition of the bottom sediments by the biological treatment in No.2 tank were analyzed for 30 day and 75 days.
_
![]()
4.4.1 Reduction Tendency of the Bottom Sediments Volume
Reduction tendency of the bottom sediments volume by test is shown on,
|
Item |
Unit |
Starting day |
30days |
75days |
|
MLSS |
mg/l |
54,800 |
35,400 |
22,200 |
|
MLSS |
gr. |
1,644 |
1,092 |
666 |
|
MLSS |
% |
100 |
66.2 |
40.5 |
Table 4.5 Reducing tendency of the bottom sediments
[No.2 water tank]
The volume of the bottom sediments 1,644g in No.2 tank was reduced to 40.5%, remaining it 666 g.
_
![]()
4.4.2 Changes in the Composition of the Bottom Sediments
The results of the tests showed that the reduced volume of the bottom sediments brought some different changes indicating increase or decrease of the composition ratio mg/kg DS. It seemed to be tendency to some changes occurred while the biological treatment was performed. Changes in the composition of the bottom sediments are shown on Table 4.6.
|
Item |
Unit |
Starting day |
30days |
75days |
|
C |
mg/kgDS |
60,000 |
71,000 |
89,000 |
|
N |
mg/kgDS |
4,630 |
5,,190 |
6,920 |
|
P |
mg/kgDS |
2,250 |
3,240 |
5,360 |
|
S |
mg/kgDS |
10,200 |
4,760 |
2,100 |
|
Si |
mg/kgDS |
172,000 |
164,000 |
149,000 |
|
Fe |
mg/kgDS |
38,600 |
53,900 |
94,200 |
Table 4.6 Changes in composition of the bottom sediments
[No.2 water tank]
In regard to the composition of which volume did not change by the biological treatment, the ratio of these composition mg/kg DS in the bottom sediments tends to increase with reduction of the sediments. Also with respect to the composition of which volume reduction is larger than the volume reduction of bottom sediments by the biological treatments, the ratio of these composition [mg/kg DS] tends to decrease.
Some composition [P, Fe] in the sludge was unchanged in volume by reducing effect on sludge, whereas other compositions C,N decreased in volume, while the concentrations mg/kg DS of these compositions in decreased by the biological treatment. Volume of compositions Si, S in the sludge decreased, in parallel with the decrease of concentration.
Changes in the volume of each sediments by the biological treatment, which was contained in the sludge of the No.2 tank[ 30l],were calculated from analyzed values [mg/ kg DS] on Table 4.6 and from the volume[g] of the composition in reduced bottom sediment.
It was excluded that the volume of composition for soluble and volatile substances. Changes in the composition volume g and its ratio % are shown on Table 4.7 and 4.8.
|
Item |
Unit |
Starting day |
30days |
75days |
|
C |
g |
98.64 |
77.53 |
58.27 |
|
N |
g |
7.61 |
5.67 |
4.61 |
|
P |
g |
3.69 |
3.54 |
3.57 |
|
S |
g |
16.77 |
5.20 |
1.40 |
|
Si |
g |
282.6 |
179.1 |
99.2 |
|
Fe |
g |
63.46 |
58.85 |
62.7 |
Table 4.7 Changes in composition of the bottom sediments g
No.2 water tank[DS.gr]
|
Item |
Unit |
Starting day |
30days |
75days |
|
C |
% |
100.0 |
-21.1 |
-39.3 |
|
N |
% |
100.0 |
-25.5 |
-39.4 |
|
P |
% |
100.0 |
-4.4 |
-3.6 |
|
S |
% |
100.0 |
-68.9 |
-91.4 |
|
Si |
% |
100.0 |
-36.7 |
-64.8 |
|
Fe |
% |
100.0 |
-8.7 |
-1.2 |
Table 4.8 Changes in composition of the bottom sediments %
No.2 water tank [%]
Each change in the composition of the improved bottom sediments in No.2 tank treated by the biological treatment is as follows;
Si.....Reduction tendency is similar to the bottom sediments.
P, Fe. Reduction is not occurred.
C,N. Reduction is less than the reduction of the bottom sediments volume.
S......Reduction is more than the reduction of the bottom sediments volume.
Fig.4.2 shows the quantitative changes g of the composition in sludge and Fig.4.3 shows the changes % of the composition in sludge in No2 water tank.
Test date 1987/10-88/02.
Test tank No.2 water tank.
Sediments 20litter plus Activated sludge 10litter.
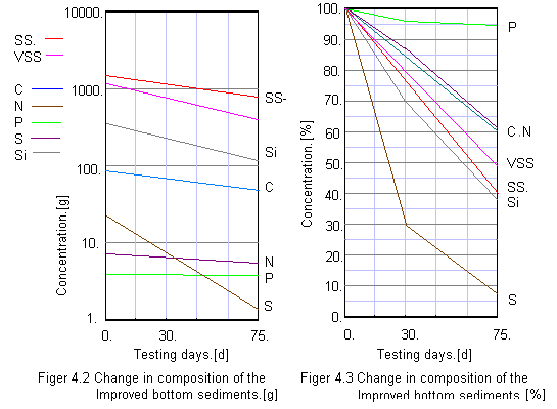
In general, amount of organic matters which consists of the sludge is changeable by the biological treatment. In this experiment, however, it was observed that each composition indicates a different pattern of change to the biological treatment.
_
![]()
4.5 Release Test
The release tests were conducted both the bottom sediments and the improved one, and studied the state of nutrient salts and effect to water quality.
_
![]()
4.5.1. Test method
Predetermined volume of the bottom sediments and the improved bottom sediments were stuffed into the tubes Id 20cm, and the marsh water was poured into the both tubes. Surfaces o the marsh water of the tubes were covered with paraffin to prevent from dissolve oxygen in the air and stirred gently not to cause diffusion of sludge, keeping predetermined temperature to observe conditions of water quality.
_
![]()
4.5.2.Test substance
Bottom sediments
Improved bottom sediments
Marsh water of Furuk
_
![]()
4.5.3.Test equipment outline
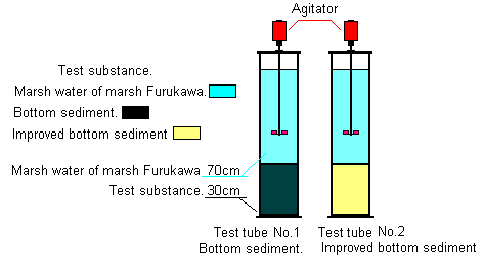
_
![]()
4.5.4.Changes of water quality in the release test shown on Table 4.9 and 4.10.
|
Item |
1day |
3day |
5day |
10day |
20day |
30day |
|
BOD |
1.2 |
1.9 |
2.0 |
1.8 |
1.5 |
2.0 |
|
COD |
3.5 |
4.8 |
5.0 |
6.2 |
7.9 |
8.1 |
|
Suifide |
0.8 |
1.1 |
1.5 |
1.8 |
3.0 |
4.6 |
|
Kj-n |
0.32 |
0.58 |
0.99 |
1.56 |
2.54 |
4.5 |
|
NH3-N |
0.02 |
0.77 |
0.85 |
0.93 |
2.22 |
4.54 |
|
NO2-N |
0.028 |
ND |
ND |
ND |
ND |
ND |
|
NO3-N |
0.2 |
ND |
ND |
ND |
ND |
ND |
|
T-N |
1.17 |
1.35 |
1.84 |
2.50 |
4.76 |
10.46 |
|
PO4-P |
0.004 |
0.032 |
0.088 |
0.098 |
0.140 |
0.185 |
|
T-P |
0.012 |
0.034 |
0.125 |
0.23 |
0.53 |
2.16 |
|
DO |
5.6 |
1.2 |
0.5 |
0.4 |
0.4 |
0.4 |
Table 4.9 Changes of water quality in tank by release test
[bottom sediments] mg/l
|
Item |
1day |
3day |
5day |
10day |
20day |
30day |
|
BOD |
1.2 |
1.2 |
1.0 |
0.9 |
0.8 |
0.5 |
|
COD |
3.5 |
4.6 |
3.5 |
3.2 |
3.1 |
3.0 |
|
Suifide |
0.8 |
ND |
ND |
ND |
ND |
ND |
|
Kj-n |
0.32 |
0.38 |
0.20 |
0.12 |
0.18 |
0.58 |
|
NH3-N |
0.02 |
0.12 |
0.10 |
0.12 |
0.02 |
0.06 |
|
NO2-N |
0.028 |
ND |
ND |
ND |
ND |
ND |
|
NO3-N |
0.8 |
0.57 |
0.42 |
0.20 |
0.20 |
0.21 |
|
T-N |
1.17 |
0.98 |
0.62 |
0.32 |
0.38 |
0.77 |
|
PO4-P |
0.004 |
0.004 |
0.004 |
0.006 |
0.008 |
0.010 |
|
T-P |
0.012 |
0.030 |
0.025 |
0.022 |
0.024 |
0.022 |
|
DO |
5.6 |
1.8 |
0.8 |
1.0 |
0.8 |
0.8 |
Table 4.10 Changes of water quality in tank by release test
[improved bottom sediments] mg/l
_
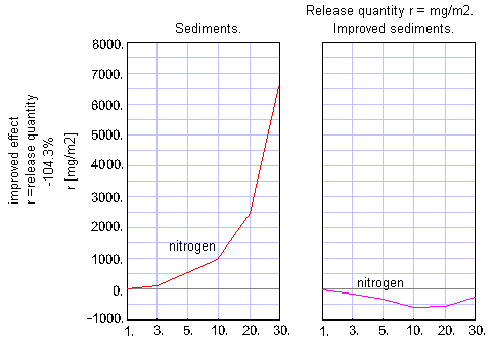
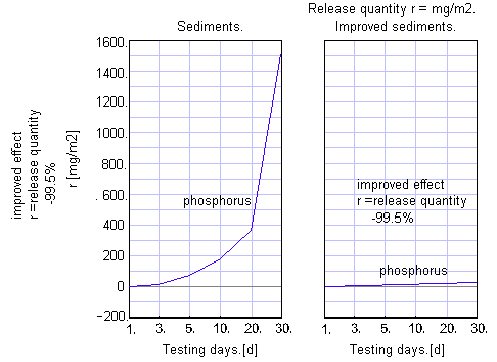
Fig.4.4 shows the results tests of the bottom sediments and the improved bottom sediments.
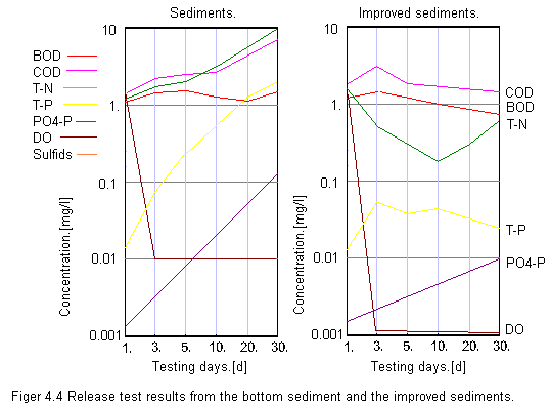
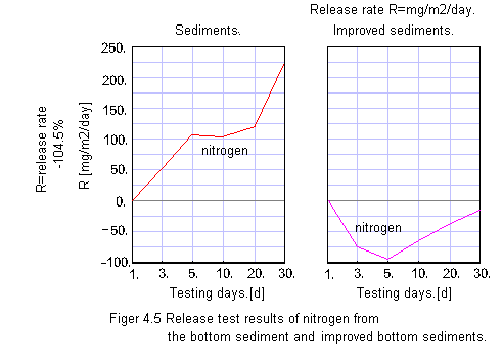
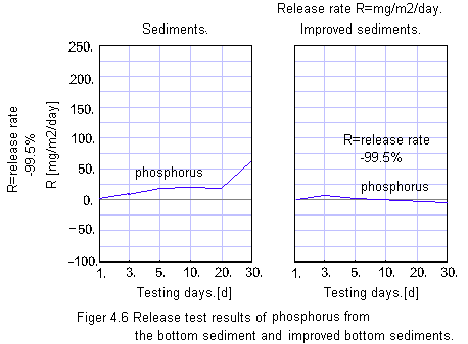
The above figure indicates test results under de-oxygen state. There are obvious differences in the release characteristics release rate and quantity between two kinds of the bottom sediments. Especially total nitrogen has a remarkable difference, that is, total nitrogen in the improved sediments shows decreasing tendency against releasing.
Fig. 4.5 and 4.6 show the release quantity and rate of the bottom sediments and the improved bottom sediments.
Release test result for BOD and COD is shown on Fig.4.7
_
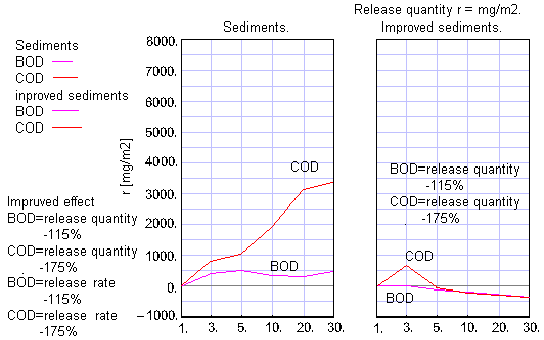
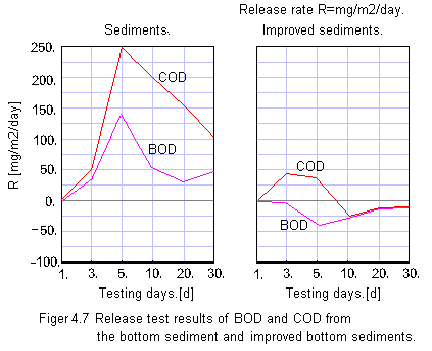
The above figures were resulted from the release tests under de-oxygen state. Changes in the COD value tended to lag behind the BOD value .Correlation's were observed between COD and BOD values.
_
![]()
4.6.Gas Generation Test
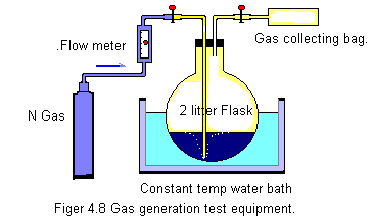
Gas generation test was carried out to study sludge characteristics for the bottom sediments and improved bottom sediments. 100g of the bottom sediments picked up from the marsh and the same amount of the improved bottom sediments from the No.2 water tank were put separately into two flasks capacity 2l. 900 ml of distilled water was added into each flask and flasks were quickly plugged by rubber plugs, then test equipment arranged as shown on Fig.4.8.
When the temperature in flasks reached to]the constant temperature, after keeping it constantly one hour, the pinch cock was opened to send nitrogen gas to the flasks at the speed of 1l/min for 10minites, and generated gas was gathered to the collecting bag attached to the end of the pipe to analyze it promptly.
Test result is shown on Table 4.11. The bottom sediments which treated by the biological treatment restrained generation of rot odor.
|
Item |
Bottom sediments |
Improved bottom sediment |
|
Ammonia NH3-N |
105 |
16 |
|
Sulfide HS |
280 |
ND |
|
Methane CH4 |
2,100 |
8 |
Table.4.11 Gas generation rate
_
Copyright
1988- 2010 Rural Environment Research Association
All rights
reserved. Any unauthorized copying and quoting prohibited.