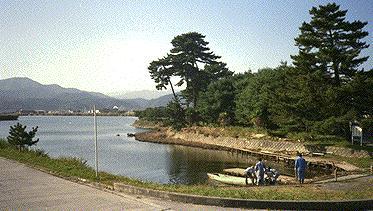
2.Marsh Furukawa
Marsh Furukawa in Rikuzen Takada city, Iwate prefecture. is the biggest natural marsh in Iwate and faces Hirota-bay in Rikuchu coast. Marsh Furukawa has brackish water, an area of 90,000m, the storage capacity of 159,000m, and average water depth of depth of 1.77m.
In marsh Furukawa there had been plenty fishes and shells, wild birds, and even salmons ascending to the born river, where people could enjoy. In 1960, after Sanriku-coast was hitted by big tidal waves caused by the Chile earthquake, the tide embankments were constructed along by Takada pine groves.
Marsh Furukawa became a party closed water area because of obstructing the exchange water between marsh Furukawa and Hirota-bay after the tide embankments constructed. In consequence the marsh has been eutrophicated since 1970s by polluted substances discharged from Rikuzen Takada city.
The area surrounding marsh Furukawa has been designated to Sanriku Rise Resort as a people s resort area in the community Their enthusiasm is indicated in the slogan Restoration of beautiful marsh and creation of the marsh where people can study nature .
Photo 1: Marsh Furukawa
_
![]()
2.1. Water Quality of Marsh Furukawa
Present water quality of the marsh is shown on Table 2.1
|
m |
0.00 |
0.25 |
0.50 |
0.75 |
1.00 |
1.25 |
1.50 |
1.75 |
2.00 |
2.25 |
2.50 |
|
|
DO |
mg/l |
10.7 |
15.7 |
14.2 |
11.8 |
6.4 |
4.6 |
0.9 |
0.6 |
0.3 |
0.3 |
0.3 |
|
Cl |
mg/l |
76 |
250 |
350 |
790 |
1040 |
1120 |
1210 |
1340 |
1500 |
1540 |
1540 |
|
SS |
mg/l |
7.4 |
10.6 |
12.9 |
19.2 |
22.1 |
19.7 |
28.1 |
81.3 |
43.4 |
56.5 |
4580 |
|
BOD |
mg/l |
12.4 |
9.7 |
11.3 |
14.5 |
18.3 |
15.4 |
14.3 |
18.2 |
110 |
90.8 |
113 |
|
COD |
mg/l |
4.3 |
6.8 |
9.4 |
14.4 |
25.5 |
21.3 |
136 |
36.7 |
107 |
127 |
122 |
|
T-N |
mg/l |
.0.66 |
1.83 |
2.14 |
1.41 |
2.03 |
0.98 |
1.43 |
5.21 |
26.1 |
27.7 |
67.1 |
|
T-P |
mg/l |
0.91 |
0.17 |
0.25 |
0.21 |
0.20 |
0.25 |
0.37 |
2.04 |
4.40 |
4.89 |
15.2 |
Table.2.1 Water quality of marsh Furukawa. "Vertical distribution of water quality"
2.1.1 Test date 1987/01 Water temperature 6.1-10.5C
2 1.2 Central part Water depth 2.5m
The above figure indicates water qualities at each stage of every 25 cm depth in the marsh for analyzing BOD, COD, T-N, T-P, SS, DO, and CL, items. Marsh Furukawa is classified as B type marsh by the standard shown as pH 6.5 -8.5 COD is less than 5 mg/l. Water quality of the marsh as follows:
COD value become higher as deeper depth. Increment value is related to the amount of BOD concentration .Also, increment of COD value is related to the amount of nitrogen and phosphorus, on the other side, desolved oxygen concentration is less as deeper depth.
As SS concentration is quite higher at the deepest, and suspended sludge is considered at the bottom.
Concentration of the nitrogen and phosphorus become higher as deeper, and concentrations at the bottom layer is 50times as much as surface layer.
Do shows more than 5mg below1 m from the surface. Do decreases as deeper, and deeper depth, indicating almost non-oxygen states at the bottom.
CL is high because of brackish marsh.
_
![]()
2.2. Analysis of Bottom Sediments
The analysis of the bottom sediments used dredged muddy water, was shown on Table 2.1. The bottom sediments is black colored and has extraordinary rancidity. It is much polluted; volatile solids ratio exceeded 20 ;ORP figure showed minus 580 mv; DO was not detected; and amounts of N and P were a lot. Results of bacteria tests showed that a number of coliform groups were contained in the sediments, far more than general kinds of bacteria.
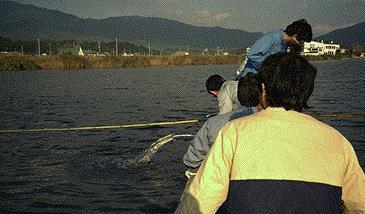
Photo 2: Surface Water 1988
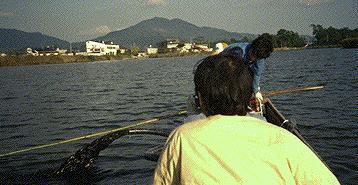
Photo 3: Bottom Sediment 1988
_
![]()
2.3. Bottom Sediments Volume
It would be estimated approximately 35,000m of the bottom sediments deposited on the bottom of the marsh.
|
Item |
Unit |
Analytic Value |
Item |
Unit |
Analytic Value |
|
Appearance |
_ |
black |
C.d. |
mg/kg/DS |
0.3 |
|
Odor |
_ |
rot |
Pb |
mg/kg/DS |
21.7 |
|
SS |
% |
8.92 |
As |
mg/kg/DS |
10.8 |
|
VSS |
% |
1.86 |
Cu |
mg/kg/DS |
82.3 |
|
VSS/SS |
% |
20.8 |
T-Cr |
mg/kg/DS |
ND |
|
pH |
_ |
8.8 |
Zn |
mg/kg/DS |
310 |
|
DO |
mg/l |
ND |
T-Hg |
mg/kg/DS |
0.09 |
|
ORP |
mv |
-580 |
PCB |
mg/kg/DS |
ND |
|
N |
mg/kg/DS |
5,340 |
Fe |
mg/kg/DS |
43,000 |
|
P |
mg/kg/DS |
2,760 |
Bacteria |
/cc |
810,000 |
|
C |
mg/kg/DS |
77,000 |
Coliform-G |
/cc |
298,000 |
|
Si |
mg/kg/DS |
12,500 |
_ |
_ |
_ |
|
S |
mg/kg/DS |
209,000 |
_ |
_ |
_ |
Table 2.3 Analysis of the bottom sediment
_
![]()
2.4. Pollution Mechanism of Marsh Furukawa
Domestic waste water from Rikuzen Takada city has caused pollution of the marsh. Water-weeds and microorganism grown in the marsh died in due time, depositing on the bottom of marsh and finally became putrefactive to affect the sediments quality worse. Moreover, heavy sea water flows into the marsh stays at the bottom, obstructing water circulation in the marsh. It was proved that the bottom water stayed just above the bottom sediments was much more polluted than surface water, that is, the condition of the polluted bottom water coincided with degree of the polluted bottom sediments.
_
Copyright
1988- 2010 Rural Environment Research Association
All rights
reserved. Any unauthorized copying and quoting prohibited.